US congressional bill analysis, part I
This post amounts to a deep dive into specific aspects of US congressional bill data, covering the years 2011-2022. The focus is on the thousands of bills over the time period that at least made it into committee review. With the help of an LLM acting as “judge,” bills are scored by a measure of general bill ambition. Using the LLM-assigned bill ambition scores, we explore the interplay between bill scores, bill characteristics, legislator characteristics, and Gallup polls of issues deemed important to US voters.
The three principal outputs for this two-part congressional blog series:
- by-bill predictive modeling results, with the outcome variable a simple composition of the LLM-assigned scores
- per-legislator scores, both yearly and, for legislators above a participation threshold, over all years they served in the 2011-2022 period
- the various datasets, and workflows used to obtain them, including the LLM-scored bills that advanced to committee review or higher, with the LLM’s reasoning
Sections:
- Data sources
- Pre-processing
- EDA, per-bill data
- Feature importance for bill ambition scores
- Conclusion
- Links
What bills this examination considered
A quick summary of how a bill advances through US Congress to become law will be helpful. Generally, a bill must go through each of the following stages (some stages may be skipped, via certain legislative advancement mechanisms):
- Introduction–the bill is formally introduced in its respective chamber (House or Senate)
- Committee consideration–the bill is picked up by relevant committee(s), where it is reviewed
- Out of committee–the bill is advanced out of relevant committee(s)
- Floor consideration–the bill is formally considered, and possibly debated, on the floor of the chamber
- Floor vote–the bill receives a vote (this includes the familiar ‘yea’ / ‘nay’ bit)
- Opposite chamber–the bill passes to the opposite chamber, to start the process all over again
- Both chambers passed–the bill makes it through the full process in both chambers
- Bill voted into law–the bill avoids presidential veto, and becomes law
A vast majority of bills do not become law. In fact most of them don’t even make it to the second stage–that of committee consideration! An iceberg analogy is useful here.
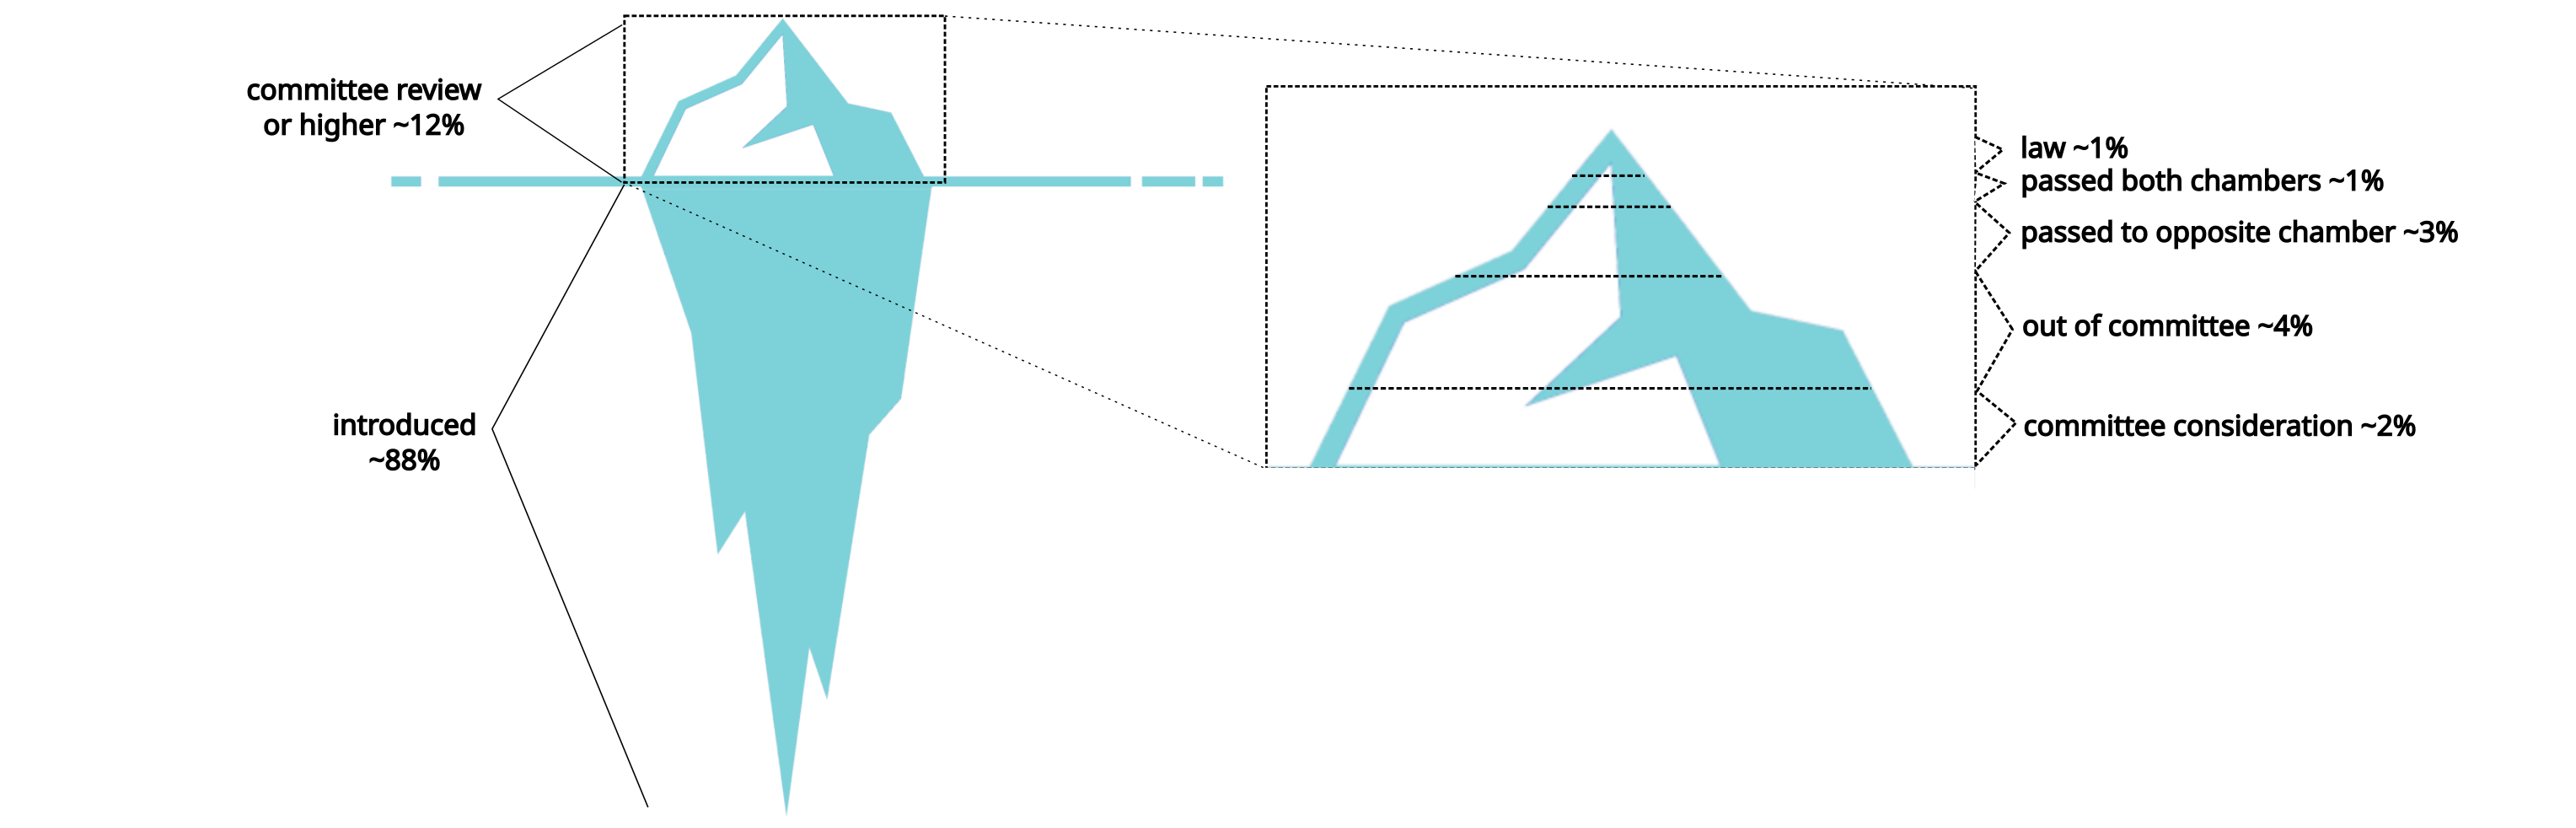
Figure 1: The iceberg analogy for congressional bill progress milestones; about 88% of bills that are introduced do not even make it into committee consideration; percentages in the inset on right reflect the proportion that made it to that level of progress, but no higher
Figure 1 shows the approximate breakdown of the highest level of progress achieved by congressional bills in the current era. Roughly 88% never even see a committee. The majority of the remainder fall away in subsequent stages, leaving only around 1% of the total bills introduced to become law.
This post’s bill analysis will focus on the following bills types in the upper portion of the iceberg:
- the bills made it at least into committee consideration–so the upper 12% or so
- only plain, public bills will be considered–this is a majority of bills; this precludes the following: private bills, simple resolutions, joint resolutions, and concurrent resolutions
The two cuts result in approximately 12,000 bills, out of approximately 96,000 total, for the 2011-2022 period under study.
Why choose this approach?
Some analyses of congressional activity focus only on bills that make it into law. Utilizing an LLM to score bills based on their ambition levels, as we’ll see, allows studying a larger share of the iceberg while still keeping the exploration centered on congressional activity of significance to the American voter.
This may be especially useful when, by some measures, the number of bills passed into law has been on a downward trend for the past few decades, up to and including the mid 2020’s. To compensate, Congress has tried cramming more and more items into mega-bills. See, for example, this Reuters article.
What about the bottom of the iceberg? Well, by removing bills that did not at least receive committe consideration, we eliminate potentially unserious bills that may have had little chance of becoming law: this includes “moonshot” bills, and bills designed more as policy and issue indicators for the involved legislators, than for actual legislating.
Summary of results
Here’s a summary of main results of this post:
- of all the bill topic categories, the ambition scores for bills related to the deficit markedly underperformed all other bill categories; this in spite of bills for the deficit being about as numerous as average over all the topics considered
- modeling with feature importance suggests the following relations between bill attributes and bill ambition scores:
- the more cosponsors, the more amendments, and longer speechmaking by the bill’s sponsor correlated positively with bill ambition levels
- the importance surveyed Americans assigned the issue the bill addressed was correlated positively with bill ambition levels
- the product of the bills’ scope and depth scores, very roughly, follows an exponential decay distribution
Caveats
The main caveat for this study was the accuracy of the LLM-assigned scoring. In some cases, the amibtion score the LLM assigned to a bill could mildy or moderately diverge from a reasonable, human-assigned score. And, in other cases, there was some ambiguity in the LLM’s judgement regarding the effect the bill might have on the topic of concern: for example, an admitedly ambitious bill on deficit reduction might hope to achieve its effect through extreme austerity measures, but those measures could so drastically reduce economic activity, and associatedly government tax income, that the government has trouble paying the interest and principal on its outstanding debts. Some of this, second, ambigious-effect inaccuracy could be the result of the LLM not thinking far enough ahead. On the other hand, this ambiguity could also be due to long-standing policy debates which have no clear resolution, even among experts.
If re-visiting this work as a more formal study, the LLM accuracy concerns could be addressed in the following ways,
- utilizing a more advanced LLM: for cost reasons, the LLM-assigned bill scores were generated by Anthropic’s Claude Haiku 4.5–if staying in the Anthropic suite, not only are there more advanced models at around the 4.5 developement mark (the Sonnet and Opus class), but as of this writing, there are more developed classes of models (the 5.5 development mark)
- a ground truth, labeled score set: by engaging human experts to manually score a subset of bills, the labeled subset would allow a quantitative measure of the LLM’s scoring accuracy, with the accuracy scores included in the study
Data sources
The data sources amounted to:
- ProPublica bulk congressional bill data dumps
- legislator biographical data
- Gallup “Most Important Problem” (MIP) polling results
- a dataset measuring the degree of rhetoric used in individual congressional speeches
Some further explanation on the last two of the data sources will be helpful.
For the Gallup polling data, the Gallup organization takes monthly surveys with the question, “What do you think is the most important problem facing America today?” This is Gallup’s Most Important Problem (MIP) survey, which helps understand the priorities of the American public. For this data exploration, the total of all responses over the 2011-2022 period was sampled, and any and all topics that were (i) translatable into legislative action, and (ii) rated a proportion of more than 0.05 respondents in any given month, were recorded. The result was a total of 8 MIPs:
- affordability–this includes cost of living, energy costs, childcare costs, etc.
- deficit–related to the US deficit and federal debt
- general economy–related to the US economy, relative to voter concerns; this is the biggest category
- healthcare–related to the costs and efficiencies with respect to healthcare in the US
- immigration–related to persons entering the US via other than legal means
- jobs–related to the availability of and barriers to employment in the US
- minorities–related to the treatment and rights of minority populations in the US
- covid–anything related to covid and covid relief measures; of course, this only applied from 2020 to the end of the bill sample period (2022)
(An example of a prevalent MIP that was not directly translatable into legislative action was, “the government / poor leadership”–there’s not much Congress can do about that!)
The congressional speech dataset was from [Aroyehun]. The study examined congressional speeches throughout the entire history of US Congress. The speeches were chunked, and each chunked scored based on its tendency to make emotional appeals vs providing factual arguments. The resulting composite score, per speech chunk, was normalized and named the “evidence minus intuition” (EMI) score. A score of 0.0 suggested the text chunk was neutral, while the more negative the score, the more the chunk skewed toward emotion-based language, and the more positive the score, the more the chunk skewed toward evidence-based language.
[Aroyehun] have made their data available, a small portion was utilized for this project’s datasets. The fields related to the EMI dataset include those with the string “ckl,” indicating the total number of words in a legislator’s speeches over some trailing time window (for example 6 months), and the string “emi,” indicating an averaged EMI score, over all chunks from that legislator over some trailing time window.
Data pre-processing
The data pre-processing steps amounted to:
- determining what stage of advancement a given bill was in (committee consideration, out of committee, floor consideration, floor vote, passage into law), and then filtering out bills that did not make it into committee consideration
- putting bill summary text through an NLI entailment model, testing the text against MIP-specific lists of hypotheses
- for a given bill, for any MIP topics the NLI model deemed relevant, an LLM was fed a prompt combining topic-specific instructions, and the bill summary text; for each bill, the LLM produced two scores, each an integer in [0,10]: the bill’s scope, or how broadly it covered the topic, and the bill’s depth, or how deep the bill’s proposed changes amounted to, in context of the topic
- bill impact score:
- utilizing the scope and depth scores, each bill, MIP combination was assigned an impact score, as a measure of the bill’s relevance and utility to the American public
- score inputs:
- the LLM-assigned scope and depth scores
- mip_avg–this is the average proportion of Gallup-surveyed Americans who listed the MIP as the most important problem facing the country for the calendar year associated with the bill’s date of origin
- prog_level–a bill’s level of progress toward becoming law, the highest out of the 5 possible levels, was assigned a numeric value in [0.5,1.0], on roughly a linear scale
- the score inputs were converted into a numeric bill score via the formula, mip_avg * scope * depth * prog_level / 10.0
- two principal datasets were assembled
- a per-bill dataset
- this merged detailed bill data with the LLM-assigned per-bill scope and depth values
- this included measures of legislator oratory in the trailing 3- and 6 months from the bill’s inception, for both the sponsor and cosponsors of the bill (the cosponsors’ oratory measures were averaged)
- a per-legislator dataset
- this long-form dataset merged bill information by (bill ID, MIP) tuple to any legislators who sponsored or cosponsored that bill
- this dataset includes the formula-derived bill impact score for each (bill ID, MIP) tuple
- a per-bill dataset
EDA, per-bill data
First, we’ll take a look at a consolidation dataset that holds per-bill data, including the bill ambition scores, based on the relevant Gallup most important problem (MIP) topic, along with a few other fundamental bill properties.
This per-bill dataset holds about 9600 unique bill-MIP combinations over the 2011-2022 timeframe. The bills met the following conditions:
- the bills are “plain” bills that made it at least into committee consideration
- the bills had at least one of the scope or depth scores strictly greater than zero
A given bill could appear more than once, under different MIPs. This may especially be true of comprehensive bills, that cover multiple topics. There were about 5600 unique bills in the dataset. This puts the average number of MIPs per bill at around 2.0.
Age, experience, and gender
We’ll take a look at some of the basic per-bill details, starting with the distribution of age, congressional experience, and gender of the bill sponsors in the dataset.
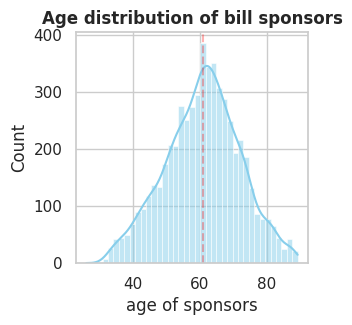
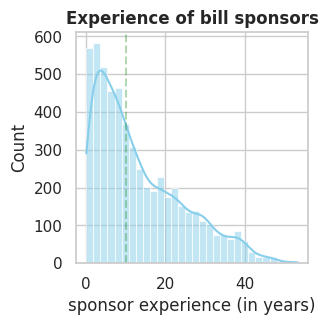
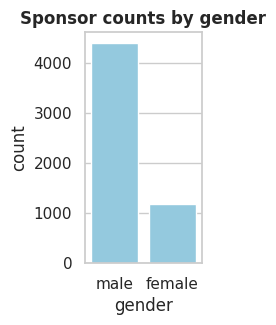
The age, experience, and gender of each bill sponsor in the year the bill was introduced was recorded and plotted. Experience is measured by the total time served in US Congress, up to and including the year the bill was introduced. To emphasize, this is a per-bill view, and a legislator could be counted multiple times, including in the same year if they sponsored multiple bills that year.
The average age of bill sponsors at the time of sponsorship is around 60. This is not really a surprise–the average age of US federal legislators is around 60.
Sponsor experience is highly skewed, with a majority having less than 10 years experience. This though may largely be an artifact of the underlying age distribution of congressional legislators–at any given point in time, the average years of experience for House members is about 9, and for the Senate it’s about 11; compare this to the vertical average-line on the plot.
For gender, sponsors are predominately male, by a ratio of about 4:1. This also is no surprise: in general, as of 2026, about 25% of legislators in US Congress were female.
Bill progress levels and MIP topic distribution
Next, a look at the distribution of bill progress levels and bill MIP topics. The progress codes are:
- ‘cmc’–the bill made it into committee consideration
- ‘ooc’–the bill made it out of committee
- ‘flc’–the bill made it into floor consideration
- ‘flv’–the bill made it to a floor vote
- ‘opc’–the bill made it out of its originating chamber (House or Senate), and into the opposite chamber
(If needed, refer to the data sources section above for an explanation of the 8 MIP topics.)
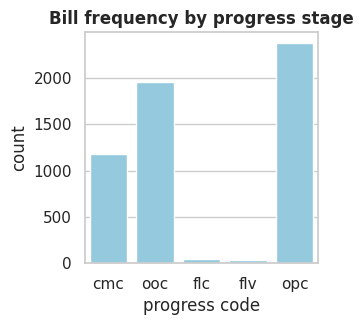
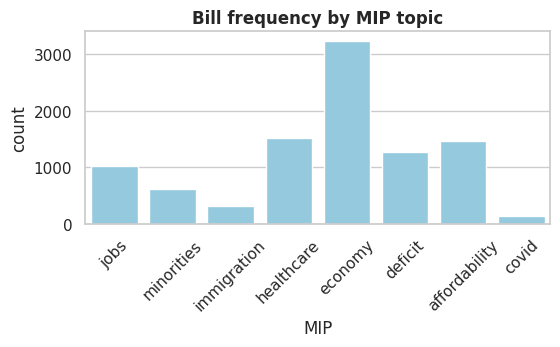
To explain the somewhat unusual bill progress distribution:
- bill ‘progress’ records the highest stage the bill achieved–so a bill that makes it into the opposing chamber necessarily had to pass a floor vote, but ‘flv’ is not recorded for that bill–only the highest stage (‘opc’)
- most congressional bills that make it to floor consideration or floor vote pass that chamber–in other words only a small percentage of bills that make it to floor consideration or floor vote fail in that chamber
These two points help explain the relatively low frequency of floor consideration and floor vote progress counts, but the relatively high frequency of chamber passage.
For the bill distributions by MIP topic, notice the MIP ‘economy’ is the largest. Note this dataset did not filter for scope and depth scores, so these per-MIP frequencies are moreso the result of the NLI entailment pre-filter. In other words, filtering by LLM scores has not really occurred yet. So reasons the ‘economy’ category has so many bills include,
- the US economy is in general a very broad category, with many legislative inputs, to include other MIPs in some capacity, such as jobs, affordability, as well as taxation, energy and infrastructure, regulation, and entitlement programs
- the entailment model, to capture the diverse possibilities for MIP ‘economy’, was correspondingly generous in its entailment hypotheses
So the high frequency of economy-related bills is a combination of genuine relevance of a wider range of bills to such a broad topic, as well as likely a higher proportion of false positives, resulting from the entailment model’s “generous” filtering.
Distribution of bill cosponsor counts and number of amendments
We’ll take a look at the distribution of the number of cosponsors of unique bills in the dataset.
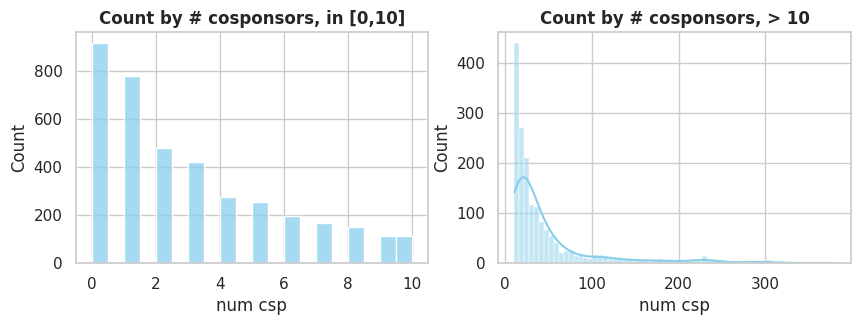
Notice the frequency of bills falls off at a steady rate as the number of cosponsors increase. Some, but not many, bills evidently have hundreds of cosponsors.
Next a look at how many amendements these bills accumulated.
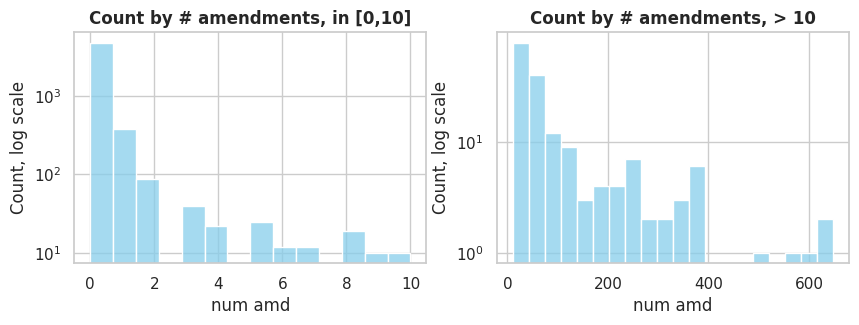
Again, the greater the number of amendments, the fewer the number of bills. A significant number of bills have 5 or fewer amendments. Some have hundreds.
Correlations among bill attributes
With basic bill attributes included alongside scope and depth scores, a basic correlation plot might amongst numeric predictors might help suggest important links–for example, between bill ambition levels and bill attributes.
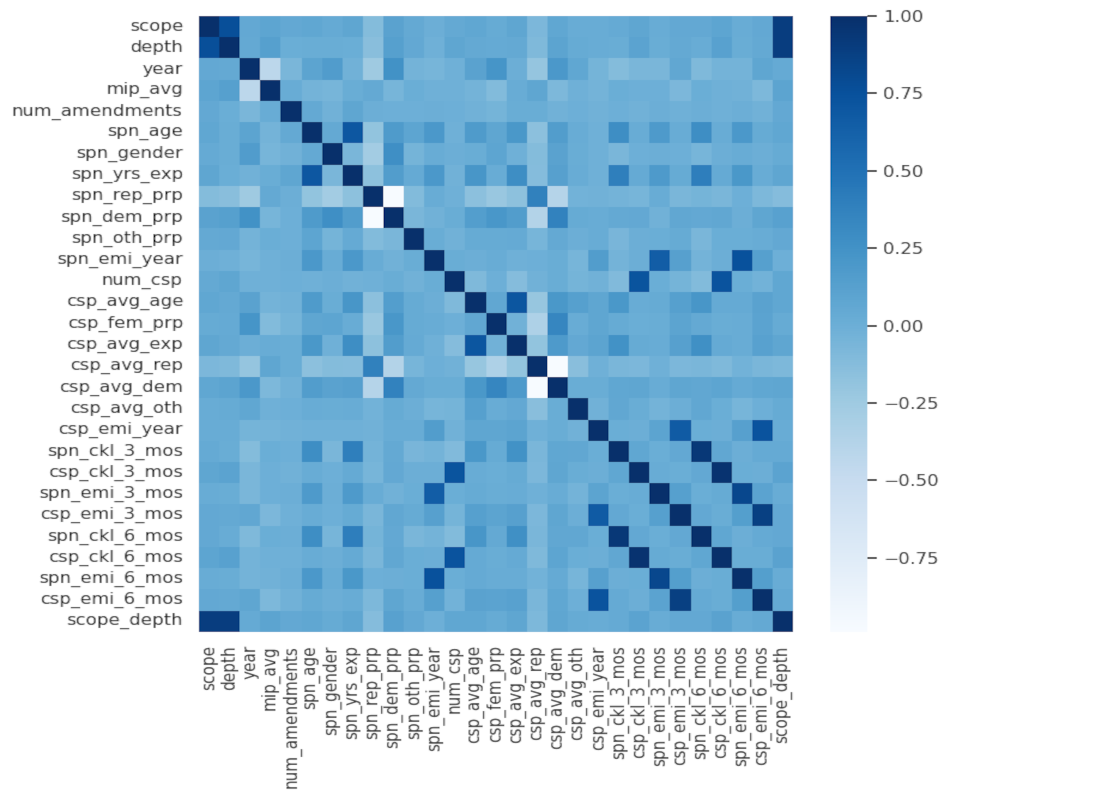
For the correlation heatmap:
- for the most part, correlations among the numeric categories are quite muted
- most of the outlier correlations are expected:
- (scope, depth)–this is the LLM bill scope and bill depth rating
- (spn_age, spn_yrs_exp)–sponsor age and sponsor years of experience
- (csp_avg_age, csp_avg_exp)–average age and experience over all cosponsors for a given bill
- (csp_ckl_3_mos, csp_ckl_6_mos, num_csp)–sum of number of words for speeches over all cosponsors in bill lookback window, and number of cosponsors
- (spn_ckl_3_mos, spn_ckl_6_mos)–number of words for sponsor speeches in bill lookback window, at 3- and 6- months
- various emi scores
- for sponsors at 3 and 6 months and for the calendar year emi
- for cosponsors at 3 and 6 months and for the calendar year emi
- note this likely principally comes from the fact the 6 month scores “contain” the 3 month scores; and similarly, on average, the calendar year scores contain a significant chunk of the 6- and moreso 3-month scores
- various rep and dem prp’s
- some are a little more subtle
- spn_yrs_exp and spn_ckl at 3 and 6 months–here, the more experienced the bill’s sponsor, the more speeches that fell in the bill’s lookback window (maybe just more experienced legislators talk more)
- spn_age and spn_yrs_exp show somewhat negative correlations against spn_rep_prp and csp_avg_rep–this could be because “rep”s who sponsor or cosponsor bills tend to be younger and less experienced, or simply that overall, “rep” legislators are younger and less experienced
- spn_dem_prp is somewhat positively correlated with csp_avg_age, csp_fem_prp, and csp_avg_exp–this suggests, in accord with the complementary result for “rep” version, that the “dem” may have the greater age and experience in general, or perhaps disproportionately older, experienced cosponsors tend to support “dem”-sponsored bills
- spn_dem/rep_prp is positively/negatively correlated with csp_avg_dem/rep–this makes sense, since presumably “rep” sponsors would likely attract “rep” cosponsors, and same for “dem”
- year (ie the year the bill was introduced) shows some mild but unusual correlations
- negative with mip_avg, spn_rep_prp, csp_avg_rep–mip_avg may reflect changing “mixtures” among the mip survey proportions–for example later years in the 2011-2022 range may see more concentrated mip scores, in just one or two of the 7 to 8 mip’s; for the “rep” fields, this may reflect less engagement by the “rep” side as the years go on, or greater “dem” engagement over time–this is likely attributable to shifting party majorities in the two chambers over time, which is made clear in Part II
- positive with spn_dem_prp, csp_avg_dem, csp_fem_prp–this supports the notion of somewhat greater “dem” engagement over the 2011-2022 time span (ie increasingly “dem” are engaging with bill generation than “rep”), and, again, is likely do to shifting party majorities in the chambers over time; the csp_fem_prp indicates more female involvment cosponsoring bills over time–possibly from greater engagement of existing female legislators, or an increasing proportion of females among the legislators
Bill scores and related distributions
Next, we’ll take a look at the distributions of the LLM-assigned per-bill, per-mip, scope and depth scores.
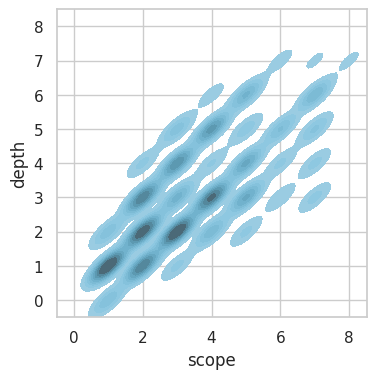
The KDE plot shows,
- a high correlation between the LLM-assigned scope and depth scores
- most bills do not score more than 4 on either scope or depth
Specifically, the correlation coefficient is r=0.76. A correlation of 0.76 is a relatively high value. Considering the relatively high correlation coefficient, let’s take a look at how the product scope*depth over all bills is distributed.
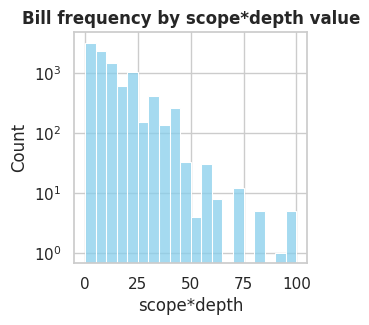
With the y-axis on log scaling, this shows, very roughly, an exponential falloff in the frequency of bills against the scope*depth value.
Next, to get a better feel for the scoring, let’s look at a few particular bills. What were some of the highest scoring bills, as scored by the LLM?
| session | chamber | bill_num | mip | year | scope*depth | title | scope | depth | date_intro | |
|---|---|---|---|---|---|---|---|---|---|---|
| 0 | 113 | hr | 45 | healthcare | 2013 | 100.0 | To repeal the Patient Protection and Affordabl... | 10.0 | 10.0 | 2013-01-03 |
| 1 | 112 | hr | 6079 | healthcare | 2012 | 100.0 | To repeal the Patient Protection and Affordabl... | 10.0 | 10.0 | 2012-07-09 |
| 2 | 112 | s | 192 | healthcare | 2011 | 100.0 | A bill to repeal the job-killing health care l... | 10.0 | 10.0 | 2011-01-26 |
| 3 | 113 | s | 177 | healthcare | 2013 | 100.0 | ObamaCare Repeal Act | 10.0 | 10.0 | 2013-01-29 |
| 4 | 116 | hr | 1384 | healthcare | 2019 | 100.0 | Medicare for All Act of 2019 | 10.0 | 10.0 | 2019-02-27 |
| 5 | 113 | s | 1292 | healthcare | 2013 | 90.0 | Defund Obamacare Act of 2013 | 10.0 | 9.0 | 2013-07-11 |
| 6 | 116 | s | 4800 | covid | 2020 | 81.0 | The Heroes Act | 9.0 | 9.0 | 2020-10-19 |
| 7 | 117 | hr | 1319 | covid | 2021 | 81.0 | American Rescue Plan Act of 2021 | 9.0 | 9.0 | 2021-02-24 |
| 8 | 114 | hr | 1148 | immigration | 2015 | 81.0 | Michael Davis, Jr. in Honor of State and Local... | 9.0 | 9.0 | 2015-02-27 |
| 9 | 112 | hr | 2 | healthcare | 2011 | 81.0 | To repeal the job-killing health care law and ... | 9.0 | 9.0 | 2011-01-05 |
| 10 | 116 | hr | 6800 | covid | 2020 | 81.0 | The Heroes Act | 9.0 | 9.0 | 2020-05-12 |
| 11 | 115 | s | 1757 | immigration | 2017 | 72.0 | Building America's Trust Act | 9.0 | 8.0 | 2017-08-03 |
| 12 | 117 | hr | 1280 | minorities | 2021 | 72.0 | George Floyd Justice in Policing Act of 2021 | 9.0 | 8.0 | 2021-02-24 |
| 13 | 116 | hr | 1384 | affordability | 2019 | 72.0 | Medicare for All Act of 2019 | 9.0 | 8.0 | 2019-02-27 |
| 14 | 117 | hr | 7007 | covid | 2022 | 72.0 | COVID Supplemental Appropriations Act, 2022 | 9.0 | 8.0 | 2022-03-09 |
| 15 | 115 | hr | 4760 | immigration | 2018 | 72.0 | Securing America's Future Act of 2018 | 9.0 | 8.0 | 2018-01-10 |
| 16 | 116 | s | 4800 | jobs | 2020 | 72.0 | The Heroes Act | 9.0 | 8.0 | 2020-10-19 |
| 17 | 117 | hr | 5376 | affordability | 2021 | 72.0 | Inflation Reduction Act of 2022 | 9.0 | 8.0 | 2021-09-27 |
| 18 | 113 | s | 744 | immigration | 2013 | 72.0 | Border Security, Economic Opportunity, and Imm... | 9.0 | 8.0 | 2013-04-16 |
| 19 | 116 | hr | 6800 | jobs | 2020 | 72.0 | The Heroes Act | 9.0 | 8.0 | 2020-05-12 |
The top 20 show a majority dominated by ambitious bills related to healthcare, as well as Covid relief measures. The Heroes Act appears 4 times, which amounted to two different Covid relief measures, one in the House and one in the Senate. It appears under two different MIPs in each case–covid and jobs–since the LLM deemed it to have significant impact under both those topics. There are also numerous bills attempting to repeal the Affordable Care Act. The LLM correctly deemed such bills to have large scope and depth effects in the healthcare MIP, though it’s a matter of open debate what effects such acts would have on healthcare quality, availability, and costs for Americans (which concerns were included in the LLM scripts for healthcare–so the LLM in some sense made its own judgement call for these).
Some of the bills are perhaps not obvious from their titles. For example, HR 1148 in the 114th session, the “Michael Davis, Jr. in Honor of State and Local Law Enforcement Act,” has the following LLM reasoning for its scores:
‘This bill has exceptionally broad scope, addressing all four criteria extensively: (1) enforcement is heavily emphasized through state/local law enforcement cooperation, detention facility expansion, and ICE officer increases; (2) border security is addressed through criminal penalties for unauthorized entry and expedited removal procedures; (3) immigration reform appears throughout, including visa security enhancements, SEVIS monitoring, and expanded grounds for inadmissibility/deportability; (4) the refugee/asylum system is restricted through new ineligibility categories (aggravated felons, gang members, etc.). The depth is also very high, as the bill proposes substantial, permanent structural changes including criminal statute expansions, retroactive application of new grounds for deportation, mandatory detention policies, significant expansion of law enforcement authority at state/local levels, and comprehensive information-sharing systems. The bill represents a comprehensive overhaul of immigration enforcement rather than incremental adjustments.’
So this was a bill proposing extensive immigration reforms, most related to security. While HR 4760 in the 115th session, the “Securing America’s Future Act of 2018,” has the following LLM reasoning:
‘This bill has broad scope, addressing all four criteria: border security (physical barriers, personnel, surveillance, ports of entry, National Guard), refugee/asylum system (asylum fraud provisions, unaccompanied alien children), immigration reform (visa allocation, employment-based visas, H-2C program, family visa restrictions, DNA testing), and enforcement (employment verification, detention, deportability provisions, criminal alien deportations). The depth is substantial, proposing permanent structural changes including visa program elimination, new employment verification systems, biometric exit data systems, and significant border infrastructure investments. The bill represents comprehensive, ambitious reform across multiple immigration domains.’
So another ambitious bill related to border security and immigration reform.
To get more specific, the following violin plot shows the scope*depth distribution by MIP topic.
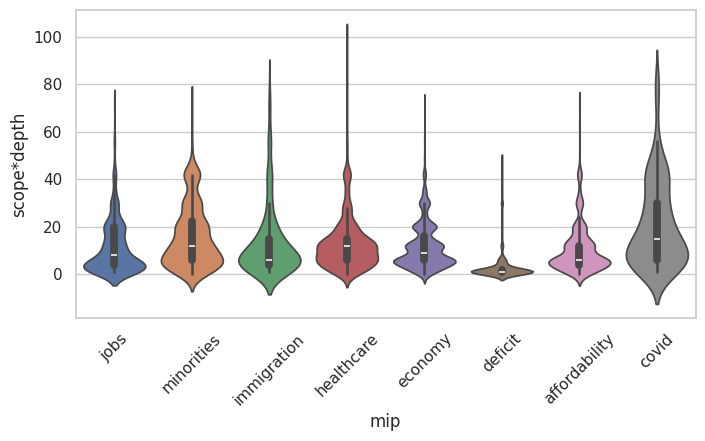
For the scores vs MIP violin plot, the standouts include ‘minorities,’ ‘covid,’ and ‘deficit’.
For ‘minorities’ and ‘covid’ the bulge toward higher scores likely reflect an emergency response by US legislators–in the first case, surrounding the high-profile race-related events in the early 2020s, to include the death of George Floyd, and in the second case, the pandemic.
For the ‘deficit’ topic, the bill scores are pronouncedly low. To explore this, refer to the “Bill frequency by MIP topic” plot above. The ‘deficit’ topic is in the middle ranges for the number of bills associated with that MIP, about the same MIPs ‘jobs’, ‘healthcare’, and ‘affordability’. Let’s look at a histogram comparing scope*depth values for ‘deficit’ against those for ‘affordability’.
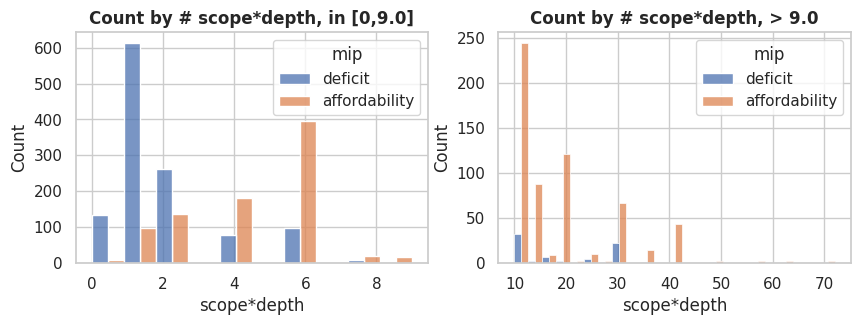
The histogram comparisons reflect what the violin plot showed–bills related to ‘deficit’ at scope*depth values greater than about 6.0 are an order of magnitude less frequent than those for ‘affordability’ at the same cutoff.
A bill was associated with a given MIP, and sent on to be judged by the LLM in context of that MIP, if an NLI entailment model flagged the bill as possibly relevant to that MIP. So it’s possible the NLI entailment model simply missed a lot of bills that (a) were truly related to the US federal debt and deficit, and (b) if they had gone on to be judged by the LLM, would have scored highly. This, however, is dubious. The entailment model workflow was designed to be “generous” in flagging anything potentially associated with the MIP in question. In other words, if anything the NLI steps should favor false positives over false negatives. So it is provisionally unlikely there is some large proportion of deficit related bills “hidden” from the LLM review, because of entailment false negatives.
This suggests US Congress is simply not able to get any significant federal debt- and federal deficit reducing legislation into committee review or beyond. This in spite of the fiscal policy tools available to the US legislature (and President) being the primary instruments for deficit and debt control.
Modeling and feature importance
Are any of the per-bill features, such as the years of experience or the bill’s legislative sponsor, informative of the bill’s LLM-assigned scores?
In this section, we’ll apply an XGBoost model with Optuna tuning to the per-legislator data, using the scope*depth score for the outcome variable. Predictive features include the years of legislative experience of the bill’s sponsor, the sponsor’s party affiliation, the number of cosponsors of the bill, the highest level of progress the bill achieved in its introduction chamber (House or Senate), the number of amendments, some characteristics of sponsor speeches in a trailing 3- and 6 month window prior to the bill’s date of introduction, as well as the averages of some of these characteristics over all the bill’s cosponsors, if applicable.
Note that several, less complex, and some much more interpretable models were applied to the same data first–but these models showed relatively poor prediction results (R^2 of about 0.15 at most). The reduction in variance improved significantly with random forest models (R^2 of about 0.35), and a bit further with XGBoost (to an R^2 approaching 0.40). The downside of more complex models like XGBoost is interpretability. For some modest insights into what of the features might be driving the value of the scope*depth outcome, SHAP scores are applied after the XGBoost model is fit.
To help improve the accuracy of feature importance ratings post-modeling, we remove some of the fields / columns / features contributing to high correlations. Variance inflation factors were then checked, leaving a maximum VIF of around 4.5 and a mean VIF of around 1.8 over the remaining 28 features.
The best model fit scores were,
RMSE: 1.203800282948619
R2: 0.38475592235182676
We than ran SHAP / Shapely on the fitted model for some feature importance estimates.
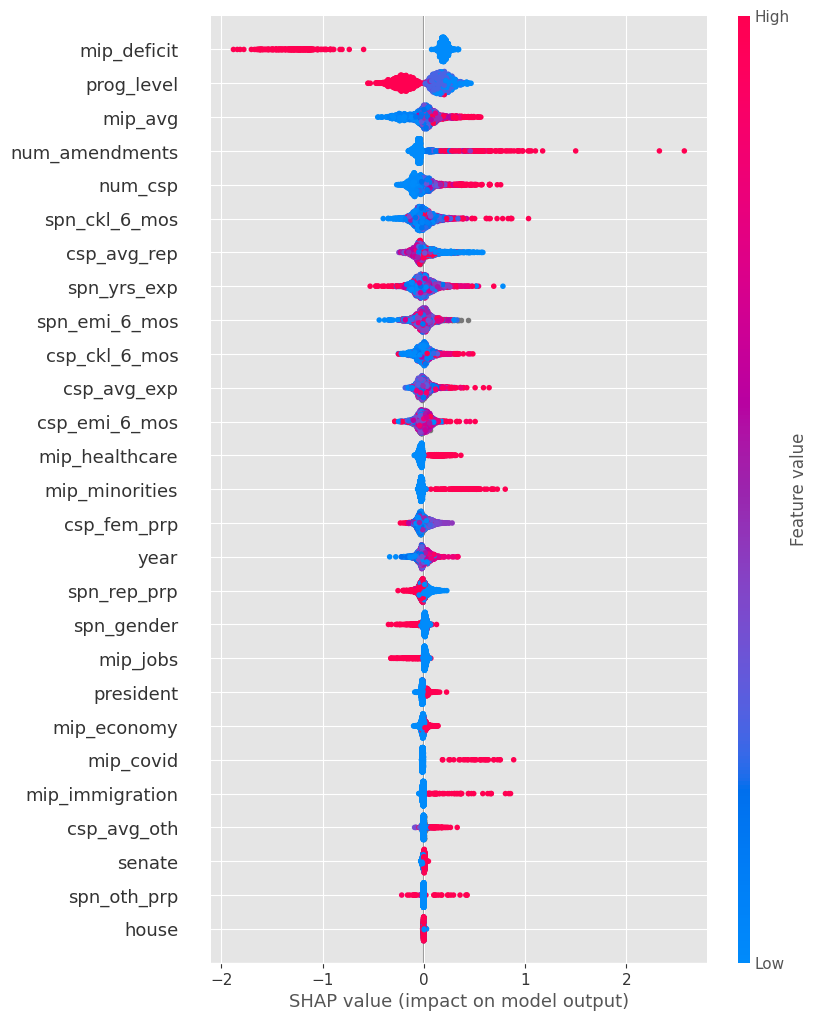
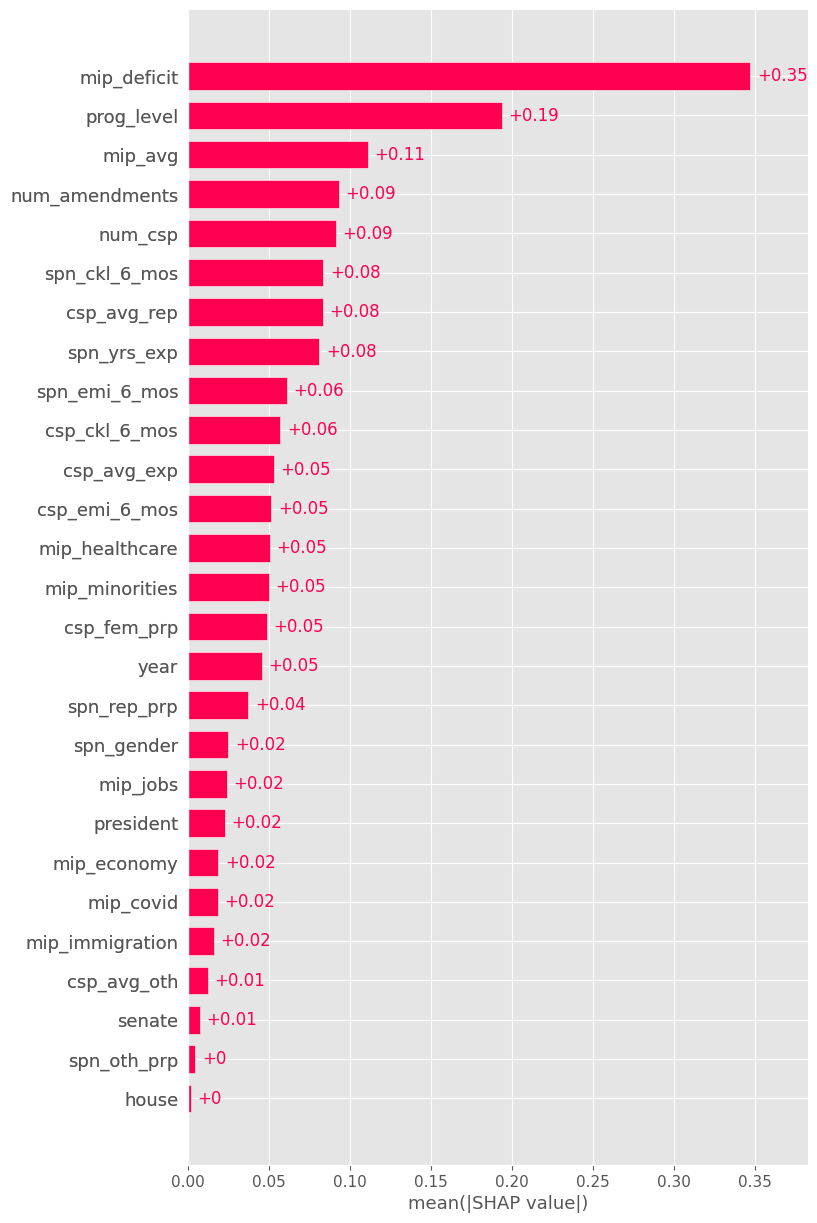
The most significant feature for the SHAP scores is the indicator variable assigned to the MIP deficit. This agrees with some of our EDA above, indicating relatively few ambitious bills on the topic of the deficit were admitted for committee consideration (and higher) in the 2011-2022 timeframe.
A measure of bill progress level also had relatively high effects. This could simply mean that more ambitious bills have a harder time moving higher in the progress stages toward becoming law.
The number of cosponsors is also featured, suggesting that, under the right conditions, the larger the number of bill cosponsors, the higher the bill score. Similarly with the number of amendments.
Somewhat reassuringly, the average MIP proportion assigned by surveyed Americans also appears in the top features. The larger the proportion of Americans indicating the given MIP was a concern, the higher the bill’s score (subject, again, to whatever possibly complex conditions the model associated with this correlation).
Two of the speech variables also appear in the top features. These are the total “chunk length,” a measure of the number of words in speeches recorded for the bill’s sponsor (spn_ckl_6_mos), and the sum of this speech word count over all the bill’s cosponsors (csp_ckl_6_mos). If either of these values were proportionately high, under the right conditions, this appeared to have a positive effect on the bill’s scores. However, this is more significant for the sponsor speeches, since the cosponsor speech chunk length is a total over all cosponsors, and would be correlated to the number of cosponsors for the bill, which was predictive of bill ambition on its own.
Overall, the SHAP results might be useful for hypothesis generation. The r^2 for this model, though much better than some of the simpler models like linear regression, was fairly weak. It seems likely that more features would need to be added to improve predictability further. For example, a measure of sponsor (and aggregate cosponsor) success with prior bills, or a history of sponsor (and aggregate) cosponsor prior bill ambition.
Conclusions
We’ve described the collection and pre-processing steps, and presented some EDA and modeling associated with the per-bill US congressional dataset. Some of the analysis highlights, as mentioned in the introduction,
- the bill ambition score product, scope*depth, roughly followed an exponential decay distribution; this is not surprising, given it’s likely much more difficult to get highly ambitious bills into committee review and beyond
- bill ambition on the MIP topic of the deficit and debt reduction was markedly lower than all the other MIP categories
Modeling on per-bill characteristics with the scope*depth score product as the outcome variable also provided some insights. Not shown were several tries with less complicated, but more interpretable models than XGBoost. This included forms of linear regression. We emphasize that these simpler models had significantly lower R2 scores, and so were not included in the final writeup. From the XGBoost feature importance SHAP scores,
- bill ambition levels did, fortunately, have some correlation to how important Americans deemed any MIPs the bill was related to; in other words, there is some evidence to suggest US legislators are being responsive to Americans’ concerns (in spite of some of the top MIPs in the Gallup surveys entailing strong disapproval of the general leadership!)
- more cosponsors, more amendments, and longer speechmaking by the sponsor, all had positive correlations with bill ambition scores
Note that in spite of the XGBoost model performing better than others, it nonetheless had a relatively weak R2 score. Given that, and the general opaqueness of XGBoost models, and the lack of statistical inference, the SHAP scores need to be interpreted with caution.
Questions and considerations for further research include the following:
- The prediction accuracy for the XGBoost gradient tree based model was mild to moderate at best; this implies there may be a lot of other information that we’re missing that predicts whether a bill will be ambitious–what might some of those other inputs be?
- Why did measures of legislator oratory (for example, spn_ckl_6_mos) appear in the SHAP scores? is that a fluke, or a genuine signal going into bill ambition? are there consistently talkative legislators who are consistently involved in ambitious bills, or is the talkativeness / bill ambition link moreso randomly distributed among legislator output? note, to further qualify this, the SHAP beeswarm for spn_ckl_6_mos hints at a few outlier “talkers,” with the bulk of the mass fairly neutral with respect to bill ambition outcomes
- Straying a bit into federal financial health–why the marked lack of ambitious bills on deficit and debt reduction?
Another takeaway from the SHAP analysis: party affiliation of the bill sponsors and cosponsors had at best a small effect on bill ambition levels. This is desireable from a project standpoint. We want the data and LLM assessments to reflect the very tight balance in present-day America between its two major political parties. If bill ambition levels showed moderate or strong correlation with party membership, given the highly competitive nature of Congress, that would point to likely flaws in the data collection, pre-processing, and/or analysis method.
Links
The project github, with all the code is here.
The primary output datasets associated with this project are on Kaggle:
- congressional bills, by chamber progress (e.g. into committee review, etc.)
- per-bill NLI entailment scores, for MIP-related hypotheses
- LLM scores, with brief explanation, per-bill, per-MIP
- project dataset blob, with several supporting datasets (per-bill and per-legislator)
Two Kaggle notebooks that preceded this blog series’ analysis are here and here.
A dashboard allowing drill-downs into the per-legislator score information is here (as of May 2026).
For dataset sources, etc.:
- legislators data (current and historical)
- propublica
- Aroyehun, et al.
- DEBATE BERT (the NLI model)
- Gallup (splash page)
References
[Aroyehun]: Aroyehun, Segun T and Simchon, Almog and Carrella, Fabio and Lasser, Jana and Lewandowsky, Stephan and Garcia, David; Computational analysis of US congressional speeches reveals a shift from evidence to intuition; Nature Human Behaviour, 2025; DOI: 10.1038/s41562-025-02136-2; URL: https://doi.org/10.1038/s41562-025-02136-2