The noisiest places in New York City
I thought it would be interesting to perform a study of noise complaints in New York City. Evidently, I’m not the first to do this. See, in no particular order, here, and here, and here (such an exploration may be to basic data science projects as Pong is to developing coders).
This mini-analysis of noise complaints in New York City utilized the publicly-available database of New York City 311 calls. The 311 call system provides assistance in a variety of non-emergency situations, to include water leaks, potentially toxic chemicals, and, yes, noise complaints. This analysis specifically looked at noise complaints over the pre-pandemic calendar year of 2019 (1/1/2019 to 12/31/2019) for a presumably more accurate sample of noise in a typical city year.
For those not familiar with the area, New York City technically extends far beyond the skyline of Manhattan, including not just the borough of Manhattan but four other boroughs: Brooklyn, the Bronx, Staten Island, and Queens. With a population as of the early 2020’s of around 8 million people, the city can be a crowded, and yes, noisy place!
The 311 data is available here. Even for just the one year period, the 311 dataset is substantial: 600mB, with 2.4 million entries.
Python’s Pandas was employed, converting the large CSV file download from city data into a single dataframe, df_calls, for processing. Each entry (row) in the dataframe has 41 columns. Column categories include complaint type, date of complaint, incident location details, responding city agency, date of resolution, and description of resolution. Nonessential dataframe columns were removed to retain only the following 7: Created.Date, Agency, Complaint.Type, Descriptor, Location.Type, Incident.Zip, and Borough. The dataframe was further trimmed to only retain noise complaints in the Complaint.Type column, via indexing by substrings:
df_calls[df_calls['Complaint.Type'].str.lower().str.contains('noise')]
The resulting Complaint.Type column was found to hold, via Pandas casting to a categorical then calling cat.categories, 8 different noise type categories: a general “Noise” category along with 7 others; Noise - Commercial; Noise - Heicopter; Noise - House of Worship; Noise - Park; Noise - Residential; Noise - Street/Sidewalk; Noise - Vehicle. Next, a list of all NYC zip codes was obtained and used to select only incident locations within the 5 boroughs (e.g. some incident locations were given in New Jersey). Given the Python list zip_list that contained all relevant zip codes, use .loc with a boolean array:
df_calls = df_calls.loc[df_calls['Incident.Zip'].isin(zip_lst)]
For meaningful inter-zip comparison, we’re interested in the proportion of complaints per resident over the total year–so number of complaints per resident per year in final units. To accomplish this, commonly available 2020 census data on residents per zip code was obtained. The original dataframe is then grouped by incident zip code and complaint type with a groupby() call:
zip_complaint_cat = df_calls.groupby(['Incident.Zip', 'Complaint.Type'])
A size() call then produces a multiindex with complaint totals for each zip code, broken down by complaint type:
counts_per_zip_complaint_type = df_calls.groupby(['Incident.Zip', 'Complaint.Type']).size()
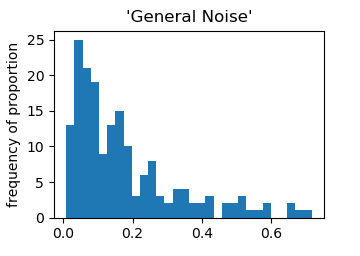
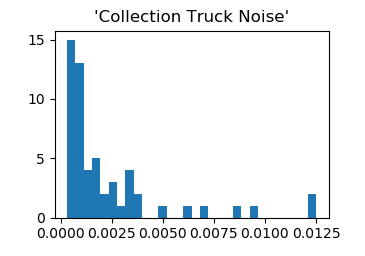
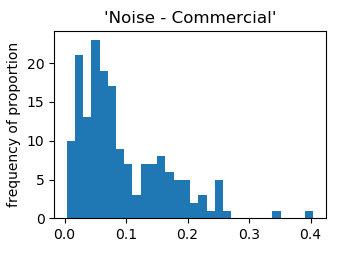
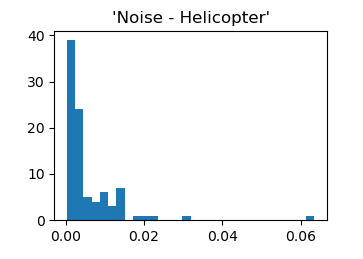
Each zip code in the resulting multiindex is divided by the respective value from the census data to produce complaint proportions for each zip and complaint type. The results are shown in Table I.
 |
 |
 |
 |
 |
 |
 |
 |
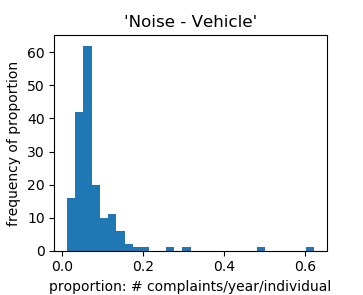 |
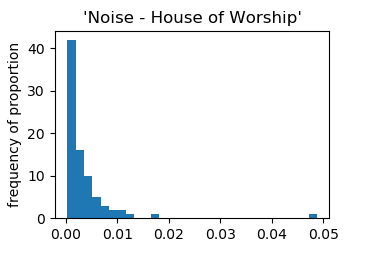
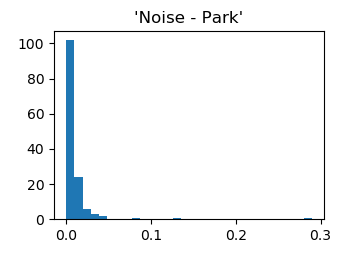
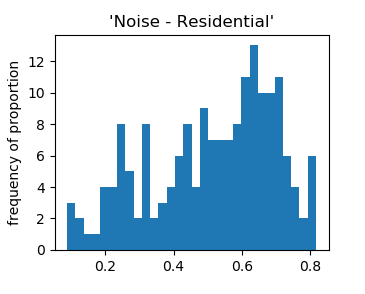
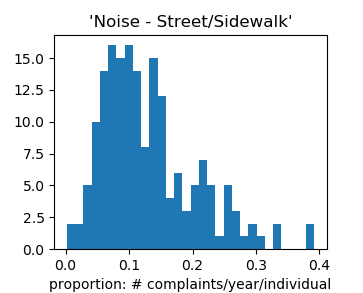
The histogram frequencies are highly varied and generally defy obvious fits to known simple distributions, though “House of Worship” and “Park” suggest an exponential or power law distribution. The “noisiest” distributions are the most unruly–these belonging to residential noise and street noise. In some zip codes the proportion of residential noise complaints is around 0.8. Precluding serial complainers, around four out of five residents of those zip codes filed a residential noise complaint in 2019.
So what were the noisiest zip codes overall in New York City in 2019? Table II shows the zip codes with the highest total proportions of noise complaints in 2019, subcategorized by complaint type.
| Table II: Ten noisiest zip codes in NYC, 2019: |
|---|
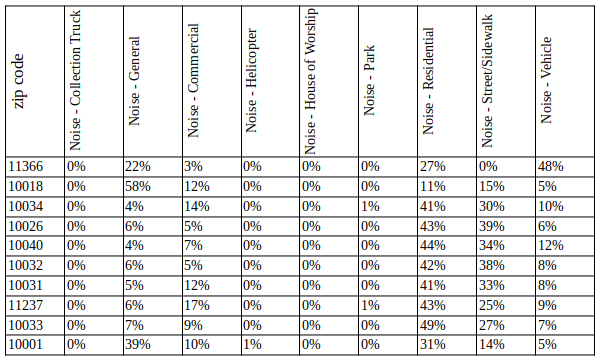 |
Most of the noisiest zips simply have a large proportion of street and residential noise. We might conclude these are simply noisy neighborhoods. There are a few zip codes with unusual noise proportions. The 2nd (10018) and the 10th (10001) on the list both have an unusually high percentage of ‘General Noise.’ In fact, the mean and standard deviation for general noise are $\mu=0.176$ and $\sigma=0.155$, putting the 2nd zip code 2.61 standard deviations above the mean and the 10th zip code 1.38 standard deviations above the mean. The 10th zip code also has quite a bit of residential noise. Since general noise is a vague label, a bit more research into the complaint data, via the complaint ‘Descriptor’ category, revealed a high proportion of construction noise (to include complaints about jackhammers). So those neighborhoods may be experiencing an unsually high but possibly temporary level of construction noise.
Even more unusual is the 1st zip code. Forty-eight percent of the 1st zip code’s noise complaints involved vehicle noise. The mean and standard deviation for vehicle noise over all zip codes was $\mu=0.076$ and $\sigma=0.066$, putting this zip code a full 6.1 standard deviations above the mean. Something unusual is going on. In fact, a little bit of web searching revealed news coverage of a lot of residential complaints about cars with ‘enhanced’ engines and stereo systems during this time period. So we might conclude 11366 was also experiencing some transient noise concerns that might pass after better arrangements are made for those noisy cars.
So there you have it, a basic analysis of noise complaints in NYC in 2019. As a final disclaimer. Please do not base any decisions about the great city of New York on this minimal analysis. Much more research would be needed to legitimately claim any of the zip codes appearing here are truly the city’s noisiest. For instance, anomalies such as serial complainers or groups unusually sensitive to noise, or block parties and other special events, or particularly concentrated noisy sections that are not representative of the zip code region as a whole, would have to be factored out.