Assessing the complexity of entities: the knowledge build complexity
The purpose of this post is to outline a general complexity measure for arbitrary entities based on human knowledge inputs.
Introduction
How do we measure the complexity of an arbitrary entity? Suppose we want to assign a complexity score to a paperclip? Or a microprocessor?
A paperclip is about the same size as a microchip, but intuitively it’s much less physically complex. We might point to notions of fine structure, or how much order one needs to impose: the paperclip’s construction amounts to its zinc-coated steel, an arrangement of molecules that is allowed to be fairly arbitrary, other than the wire shape and macroscopic bends, and some torsion requirements so that the clip holds paper. The microchip however has significant microscopic portions that are anything but arbitrary–high degrees of ordering in the VLSI innards for instance, with each individual transistor on the scale of nanometers.
Mathematics can also give us some hints. It has formal methods for assigning complexity to mathematical objects. For example, regarding a sequence of symbols as a value drawn from a probability distribution we have the Shannon entropy. We also have for all possible sequences of a given length over a fixed alphabet universal measures of minimal description, such as the Kolmogorov complexity. Many complexity measures have been proposed in the context of manufacturing processes along these lines 1. Such measures often reduce to Shannon entropy, for systems which can be in a large variety of states modeled under some probability distribution function, or graph theoretic complexity measures, for physical systems with many interconnected parts.
OK, but what about a diamond? or DNA? or quantum randomness? Snow on a display monitor such as a TV screen can be highly random, and therefore is highly complex under, say, Shannon entropy. On the other hand, an encoded internet signal designed to maximize its use of bandwidth can also be regarded as a highly complex bitstream. So is the observer and the “usefullness” of the information important? Should both the snowfield on the TV screen and the compressed internet transmission be considered equally complex? The snowfield is mathematically complex, but is likely meaningless to the viewer, while the compressed internet signal holds abundant information.
A good starting point to address these questions is Seth Lloyd’s categorization of complexity measures into three principal categories:
- difficulty of description
- difficulty of creation
- degree of organization–this includes both the difficulty of description applied to organizational structure (e.g. how the parts are put together), and the amount of information shared between parts of the system
The difficulty of description certainly helps differentiate the microprocessor from the paper clip, and fits our intuitive notions of why those two entities so strongly differ in complexity. To explain a paper clip, it may require only a paragraph of minimalist prose. To explain a microprocessor, it might take a book, or books. But we still need to agree on a common knowledge baseline: the paper clip might still be difficult for someone unfamiliar with steel. Nonetheless, description difficulty also helps take care of the diamond, and DNA. The diamond has very ordered, fine-scale structure, but retains a simple description. DNA, on the other hand, has a lot of fine-scale structure but requires a lot of information to describe any particular strand.
Now what about quantum randomness, or thermal or radiational noise, such as the snowy TV screen? Arguably, difficulty of creation helps to partially address these cases. It took no human effort to make the snow on the TV screen, while the compressed internet signal took a whole lot of human effort to generate. But, in general, we need to ask “difficulty of creation” for whom? A human? or Mother Nature? or the universe?
For this post, we resolve this last and other points by restricting our complexity measurement’s scope to human knowledge inputs. The TV snow definitely took no human knowledge to create, nor does quantum randomness, nor does DNA. The question of meaningfulness is also settled. Whatever entity received a given amount of human knowledge inputs has a corresponding degree of complexity, whether informationally consumed by another human, or an alien from Andromeda.
Preliminaries of the Measure
OK for the brief background. To help motivate this post, we’ll consider potential areas of application for this measure. For one, it might be useful for indexing general anthropogenic complexity. A measure of human-generated complexity could be helpful for planning for disruptions, and for disaster theory in general: can we build structures around us that are so complex that the complexity gets away from us? Even if the complexity is not a direct cause, it can be a symptom. Resource scarcity and crises go hand-in-hand with ingenuity. The anthropologist Joseph Tainter has suggested a diminishing marginal return theory for societal collapse 2, wherein societies naturally grow more complex when faced with increasing challenges. William R. Thompson further applied some of Tainter’s ideas in studies of the collapse of the Mesopotamian civlization ca 3000-1000 BC 3. Having a quantitative measure of complexity might provide useful feedback.
More locally, the international microprocessor shortage at the time of this writing (early 2020s) is an example of a highly complex component that is associatedly, likely causally, sensitive to disruptions. Microchips, after all, depend on manipulating matter at almost a molecular level with a consistent precision that requires very sophisticated (read, for one, difficult to describe) machinery. At the time of this writing, a single factory in the Netherlands, ASML, produces the needed photolithography equipment for high-end chips. Their extreme-ultraviolet photolithography steppers have been cited as some of the most complicated machines humans have ever built. It’s correspondingly difficult to quickly create another factory to produce more of these steppers. Production of such units has been noted as one of the recent bottlenecks in the chip supply.
Similar reasoning applies to supply chains. Problems with highly interconnected, complex global supply chains, at points aggravated by just-in-time factory component scheduling, have wrought post-pandemic havoc on the availability of goods. China’s continuing pandemic measures have further roiled supply lines. (We note that supply chains however do differ from microprocessors in a central respect–that of inadvertant or emergent complexity. A supply chain on a local level might be well managed and relatively simple, but when supply chains become globally interconnected, a lot of unplanned, emergent complexity can develop. Contrast this with the microchip’s planned complexity. This will be addressed shortly in the context of our measure.)
In any case, having a general-purpose complexity measure to highlight such areas of potential vulnerability may prevent problems before they can start.
For the next section, we need to answer how, exactly, are we to form a complexity measure for human-made entities? An atomic-reductive approach would suggest going back to human knowledge inputs as the measure’s primitives. After all, nothing made by humans hasn’t been conceived of first in the mind. Everything we make is preceded by our own knowledge work. So we’ll measure the complexity of a human-made entity by measuring all of the human knowledge inputs that went into its creation.
Measuring the Measure: Lloyd’s Three Traits
Does a human knowledge inputs approach fit with our intuitions on complexity, and Lloyd’s three condensed traits?
The first of those traits tell us a more complicated entity should require more description. A high level of information for the description likely means it took more human knowledge work to generate the object. Again, it is much more difficult to comprehensively describe a microchip than a paper clip. Each facet in the description tends to attach to design complexity, and therefore more knowledge work to form the associated ideas.
As an exception, however, consider again the emergent complexity in the supply chain example. The knowledge work for a local segment of a supply chain may be relatively low, yet the global supply chain network may be inadvertantly very complex. Emergent complexity then presents as potential limitation on measurement with only human knowledge inputs. On the other hand, while the short run outcome of this situation might see human knowledge lagging supply chain complexity, the long run equilibrium should induce human knowledge inputs to “catch up,” as more minds are brought in to make sense of the complex supply chain for purposes of management and control.
For the second of the three traits, an entity that is more difficult to construct has likely required more knowledge for its creation. We’re inclined to measure difficulty by some combination of money, time, and various energy inputs. There are, however, again, exceptions. As an example, consider a solid gold toaster. Difficulty relates to an exceedingly high monetary input, the result of relative resource scarcity (of gold), yet few would consider a golden toaster particularly complicated. The trouble here more arises from how to interpret the term “difficulty.” Money does not necessarily correlate with elaborate design. Another problemmatic referent for “difficulty” is physical labor inputs. The pyramids of Giza may have required a tremendous amount of human (and maybe horse or camel or elephant) labor, yet we would not necessarily consider the pyramids terribly complicated. Whatever thought went into the construction of a pyramid would count (which may have been relatively substantial for the time), as would the knowledge inputs behind any machinery employed, or any ingenuity by the workers in applying their hands to the task.
For the third trait, an entity with high descrptive information for its construction, or relatively high information-sharing requirements between components, also suggests more minds behind the build: more human knowledge inputs to conceive of the complex assembly, or to understand and build the necessary inter-component information sharing.
Measuring Human Knowledge Inputs
How should we measure human knowledge inputs in a structured way? We need to estimate and quantify all the contributions–all the knowledge work done by all individuals–then have a way for combining the scores (or score the whole thing outright, as for instance with a graph structure).
This would be easy to do for stone age objects. Someone comes up with the idea for a wheel one afternoon, or a few happy accidents and some experimentation produces copper smelting, or bronze, or better iron all the way up to steel. But we don’t live in a simple age. So we have to comprehensively trace knowledge inputs and their antecedents and somehow derive a value from the aggregate. We need a thorough accounting of everything, from whitepapers, to scientific papers and laboratory setups, to patents, and other work by domain knowledge- or subject matter experts. And it needs to be recursive. And we need to avoid endless recursion loops, or a measure made meaningless by excessive or poorly weighted recursion that links everything to everything else! And some automation would be nice!
We’ll call this measure the Knowledge Build Complexity (KBC).
Knowledge Aspects of Entity Creation
At the bare minimum, the principal knowledge work put into creating an entity amounts to the knowledge processes required to conceive of the entity as a sum of its parts. Each part or component (if any), in turn, may have required its own knowledge work to create. This sum-of-parts decomposition can be recursively carried all the way back to some agreed-on baseline. (As an example of a knowledge-development baseline, one which we use here, consider pre-industrial earth.)
Besides the obvious direct component dependencies, to accomodate arbitrary entities, and to make measuring knowledge inputs more precise, it is helpful to emphasize two fundamental knowledge aspects usually involved in entity creation. We’ll do this with a few examples.
A purely conceptual entity, such as an idea for a process, has required primary knowledge work for its creation in the form of a combination of insight by individuals performing the knowledge processes, along with research and development (R&D) work. The R&D work may have relied on prior research, as well as current research that employed physical entities, such as lab equipment, which has its own knowledge process costs.
One step further, and the idea, if it is physically instantiable, may have physical prototypes. This increases the knowledge aspects: not just knowledge process and research work by its creators, but the physical assembly of components to create the prototype itself. Physical assembly may require tools or conceptual knowledge work that goes beyond what was required to conceive of the entity as merely an idea. The tools themselves required knowledge work to create and instantiate. Additionally of course, the prototype may be constructed of several parts that in turn have had their own assemblies from components, which required their own knowledge work, and so on.
Going beyond protoypes, an object such as a mass-produced steam engine, has likely required knowledge processes for its conception as a sum of its parts, past research, and a substantial amount of knowledge work in assembly to bring the parts needed for its creation together. An entire factory is likely required to produce steam engines at scale, and the act of assembly correspondingly more involved–transportation for equipment and tools to install it on the factory floor, along with tools and equipment needed to keep the factory fed with raw materials and maintained.
The examples suggest, beyond the principal knowledge work of conceiving of the entity as a sum of its parts, two main knowledge aspects supportive of entity creation: research, and assembly.
The Knowledge Graph of an Entity: a Single Node
Because of the recursive property of entity construction–i.e. we consider the entity as a sum of its parts, then each part in turn is considered as a sum of its parts, and so on–the basic structure for determing the KBC of an entity will be a graph, specifically a directed rooted tree. The entity complexity graph will represent each essential component for entity creation with a node. A directed edge from component A to component B will be used to indicate component B is essential in the creation of component A. The principal entity, that which the KBC is being determined of, will be at the tree’s root, and will only have directed edges leaving it.
The nodes themselves will also have a value–the value represents the knowledge work for conceiving of that node’s entity as a sum of its parts–this is the raw result of knowledge processes working over time. If the knowledge processes used any research materials, these would be assigned their own subgraph, $\mathcal{G}$(research), which branches off the node.
The knowledge processes involved in assembling the entity from its component parts are accounted for in another subgraph, that of assembly, $\mathcal{G}$(assembly), which refers to all elements required to assemble the entity and maintain its operations, if applicable.
The node then has associated with it, in total:
- an assigned knowledge value (KV), the result of knowledge process working over some time period to conceive of it
- a research subgraph, $\mathcal{G}$(research)
- an assembly subgraph, $\mathcal{G}$(assembly)
- various directed edges leading to other nodes (heading their own subtrees), representing essential components
See Figure 1 for a diagram of a single, generic node. The subgraph for $\mathcal{G}$(assembly) is not detailed, while each leader line to an individual $\mathcal{G}$(component i) refers to a respective subtree, headed by the node assigned to essential component $i$.
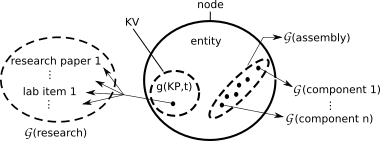
Figure 1: A Single Node of the KBC Tree
An Example: the Early Light Bulb
Shown in Figure 2 is an initial KBC complexity graph for an early-era, 1880s light bulb. Specifically, the graph applies to small-batch bulbs produced at Edison’s Menlo Park facility. It’s much easier to sketch a complexity graph for an early-industrial-age device because that time period featured far less complex equipment.
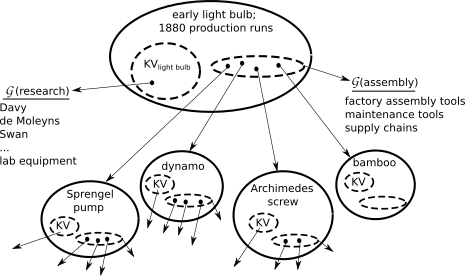
Figure 2: Initial KBC Tree for 1880s Light Bulb
A brief background on how early lightbulbs were produced will be helpful. The Menlo park facility employed several innovations in their modest bulb factory.
The whole glass bulb was fitted with a filament then heated while a vacuum pump was applied to an evacuation port at the large end. When the pressure in the bulb was low enough, a gas torch was applied to the thin glass evacuation port to collapse the tube and seal the vacuum inside the glass bulb. (Early finished bulbs had a little tip at the large end that reflected this process.) The vacuum pump was a Sprengel pump that used, of all things, falling liquid mercury to create the vacuum. The mercury had to be re-lifted upward after falling. For that they used an Archimedes lift. Menlo Park also used a Geissler roughing pump to make the process quicker, the Sprengel pump getting most of the remaining air out after the Geissler pump had lowered the pressure by an initial order of magnitude. They also used several dynamos, powered by a boiler plant. The dynamos ran motors that, for one, cut the bamboo into fibers for carbonizing. There’s more, but Figure 2 has sufficiently many components to give an idea.
Regarding $\mathcal{G}$(research), many hands were involved in the development of the bulb. Edison had a staff of highly qualified engineers who performed some of the experimental work. And there was prior art at the time. Arc lamps using carbon rods for filaments had been around since the early 1800s. And Frederick de Moleyns had filed a patent on a short-lifetime incandescent bulb in 1841. The main problem, as one might recall from grade school science, was the bulb's filament. The Menlo team had settled on carbonized cotton thread, and then carbonized bamboo fibers, as the longest-lasting. The Sprengel pump was also essential: its superior evacuation capabilities gave an almost complete vacuum, which greatly contributed to extending bulb life. All of these relatively simple research inputs would be accounted for either in the KV value for the root node, or in the root node's $\mathcal{G}$(research) subgraph. Computing the KV value may be as simple as assigning some average knowledge process expertise score, KPavg, to Edison and the Menlo Park engineers, and estimating the total time invested in thinking, experimenting, and testing:
\(KV_{\mbox{light bulb}} = KP_{\mbox{avg}}*t_{\mbox{total}}\)
Computing the KBC
It is obvious from Figure 2 that a KBC graph can grow very large. Methods of trimming the graph are worth considering if we want to produce a useful value or set of values from the graph.
Entity Baseline State
If only human knowledge inputs are relevant, then entities that don’t involve human knowledge may be removed from the graph. For example, anything biological that is conceptual, like how DNA forms and carries information, or physical, like trees used to make lumber, do not require human knowledge processes. They correspondingly have zero KV, and no component dependencies. This is shown in Figure 2, with the bamboo node. In this vein, the KBC requires the establishment of a knowledge baseline, like pre-industrial earth, where any entity that existed prior to that baseline, like mudbricks, is precluded from the KV calculation.
Occlusion and Weighting
It may further help to occlude portions of the complexity tree. Supply chains and their components, as mentioned, can be quite complex. For example, the truck used to transport materials to the factory may be more complex than what the factory manufactures. To assist with comparisons, it may help to occlude, or mask certain subtrees in the graphs. We might assume that for comparing entities A, B, and C, the supply chains are roughly similar, so we may remove them from consideration in the graphs. We may also consider subgraphs separately, and assign values to each separated subgraph, to produce a vector or tuple form for an entity’s complexity score.
Weighting may also be useful. A product may be produced in a rare configuration that adds significantly to the creation complexity. The aspects of production associated with the rare configuration may have an attenuation factor applied.
Assigning a Value to a Graph
It remains to assign a value to an entity’s KBC graph. Very generally, this requires some function that accepts a complexity tree, with numerical values at each node, and returns a value. One, simple, approach is to just add the KVs of all the nodes. Similar to the conversion of knowledge process work to a KV value, such a grand sum is left up to the measurer. Consistency is of course important for useful comparisons.
Python Routine
One advantage of the reduction to human knowledge inputs is, in this day and age of data abundance, data mining approaches can be employed to estimate a KBC score for a given entity.
A Python routine was created to automatically produce KBC estimates for arbitrary entities from Wikipedia data. Details of the routine can be found in the originating paper, with the code available on the project’s GitHub page. To summarize, the routine begins with the principal entity, and scrapes the associated Wikipedia article. Natural language processing relation extraction is then employed on sentences in the article containing high frequency anchor tag pairs, for use in deciding what relation a given anchor tag has with the article’s principal anchor tag. Relevant anchor tags, for instance those with a contained-container relationship with the principal entity, are recursed on.
The routine relies on several high-level simplifications. It estimates nodal KV solely by the Wikipedia article’s reference list for published journal articles, books, and patents, assigning a single point to each such instance. The routine makes no attempt at recursing on $\mathcal{G}$(research) or $\mathcal{G}$(assembly). Recursion depth is limited to three–amounting to the principal entity, its component entities, then the component entities of those entities–with no attempt to check for non-human-made components such as naturally occurring substances, nor a check if a component is below the baseline state. The final KBC score is calculated on the resulting graph simply by summing all nodal KVs.
The example in the paper compared a paper clip to a microprocessor. Here, the Python routine was used to compare the KBC of a toaster and an automobile. See Figures 3 and 4.
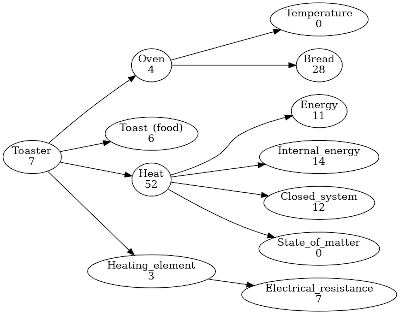
Figure 3: From Python Wikipedia routine, first three levels of complexity graph for "toaster"
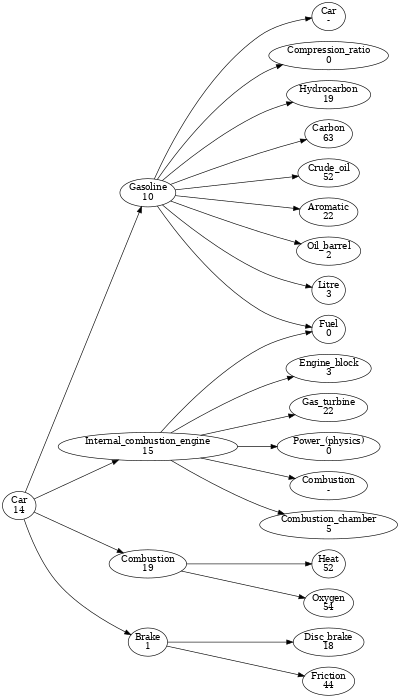
Figure 4: From Python Wikipedia routine, first three levels of complexity graph for "car"
Using the simple summing approach for nodal KV estimates, the total complexity for “toaster” was 144, and the total complexity for “car” was 418. However, several shortfalls in the relation extraction approach are evident in the graphs.
For the toaster, in Figure 3, it’s debatable a full thermodynamic treatment of “heat” is necessary to construct a toaster. Also, the routine decided to recurse on “bread” because the relation extractor correctly understood that bread goes inside toasters. However, the routine was not coded to distinguish between items that go into an entity as part of the entity’s functioning, and items that go into the entity as essential components to its construction. This difficulty occurs again when recursing on “oven,” when the routine identifies “bread” correctly with respect to container-contained, but incorrectly as an essential component–ovens are not made of bread! Removing these errors, and checking the routine did not incorrectly remove other top anchor tags in the respective component articles, yields a more accurate nodal KV sum of 21.
Similarly, for “automobile” in Figure 4, though understanding an internal combustion engine is important, an understanding of gas turbines is not. Second-level anchor tags the routine missed because of attempts to set reasonable frequency thresholds, include “assembly line” (a nodal sum of 14 at 2 recursion levels) and, perhaps, “automotive industry” (nodal sum of 4 at 2 recursion levels).
Further, for a car, there is some difference between the car off the assembly line, the car as a functioning transportation mechanism (which includes gasoline, motor oil, radiator fluid, etc.), and travel by automobile in general (which can include road infrastructure, fuel distribution infrastructure, traffic management, etc.). We’ll take the most conservative of these, the car fresh off the assembly line. As a consequence we do not consider gasoline, just as we did not consider the distribution of electricity and the power grid for the toaster.
Finally for a car, a thermodynamic understanding of heat is probably more appropriate than for a toaster, given the complexities of internal combustion engines and efficiency. “Oxygen,” under “combustion” though is another iffy inclusion. Oxygen is not human-made, and therefore lies below the componentization baseline. On the other hand, some understanding of oxygen’s chemical properties may be important to engine functioning–in this latter importance, oxygen would arguably appear in the $\mathcal{G}$(research) attendant to internal combustion engines (and not truly a component of them). So to be fair, we’ll include oxygen, but divide its KV in half.
A resulting revised automobile KBC would be a more modest 216 (to the toaster’s revised 21).
Note however, the truncation to only 3 recursion levels has the effect of bias toward the toaster, which very quickly recurses down to basic KBC baseline components. On the other hand, continuing to recurse on “automobile” would continue to turn up more and more complex components, for example the chassis, the fuel injection and environmental control systems, and likely, for a modern autombile, a lot of integrated circuits and computer code, and so on. The KBC scores would likely diverge much more if the levels of recursion could be reliably increased.
Conclusion
A complexity measure has been proposed that relies on human knowledge inputs, circumventing some of the usual difficulties and scope issues in creating a more one-size-fits-all complexity measure. For a somewhat more technical treatment, see the originating paper.
A lot more work could be done on the automation routine. Sites other than Wikipedia could be scraped. Scholarship links could be pursued more thoroughly. Rigorous aggregate complexities for, for instance, supply chains could be estimated. And the AI that parses the data for componentization relations has plenty of room for improvement. Ultimately, typing in the name of the entity would produce a reliable score on the spot, either pulled from a database of pre-computed scores, or created on the fly. In these regards, a company or research organization would have many advantages in further development.
References
-
Alkan, B., Vera, D.A., Ahmad, M., Ahmad, B. and Harrison, R. (2018), Complexity in manufacturing systems and its measures: a literature review European J. Industrial Engineering, Vol. 12, No. 1, pp.116–150. ↩
-
Tainter, Joseph The Collapse of Complex Socieites, New Studies in Archaeology Cambridge University Press, Cambridge, UK, 1988. ↩
-
Thompson, William R. Complexity, Diminishing Marginal Returns, and Serial Mesopotamian Fragmentation Journal of World-Systems Research, 613-652, fall 2004. ↩